


Before I think about price, the first thing I check on every Brisbane property is whether it floods. It takes about ten minutes, it’s free and you can do it yourself from your couch. With storm season running from October to March, and council having redrawn its creek flood maps for more than 17,000 properties in 2025, now is a good time to know how to check if a property is flood affected in Brisbane.
Below is the step-by-step I use, with screenshots from Brisbane City Council’s tools taken in October 2026.
Why it pays to check if a property is flood affected in Brisbane
Flooding affects three things I care about as a valuer: what the home is worth today, what it will cost to insure and how easy it will be to sell later. A home that went under in 2011 or 2022 can still sell well, but usually to a smaller pool of buyers and often at a discount.
It’s also on you to find out. Queensland’s seller disclosure rules, which started on 1 August 2025, give you a disclosure statement before you sign, but flood history isn’t one of the things a seller has to disclose. If you want to know, you have to check.
And the maps do change. In September 2025 council updated its creek flood mapping using new studies of the Breakfast Creek, Jindalee and Lota Creek catchments. More than 10,000 properties were added to the mapping, around 400 came off it and others had their flood extent changed. Breakfast Creek takes in Enoggera Creek and its tributaries, which run through The Gap, Ashgrove, Bardon, Red Hill and Paddington, so if you looked at a home in the inner west before then, it’s worth looking again.
Step 1: Open the Flood Awareness Map and search the address
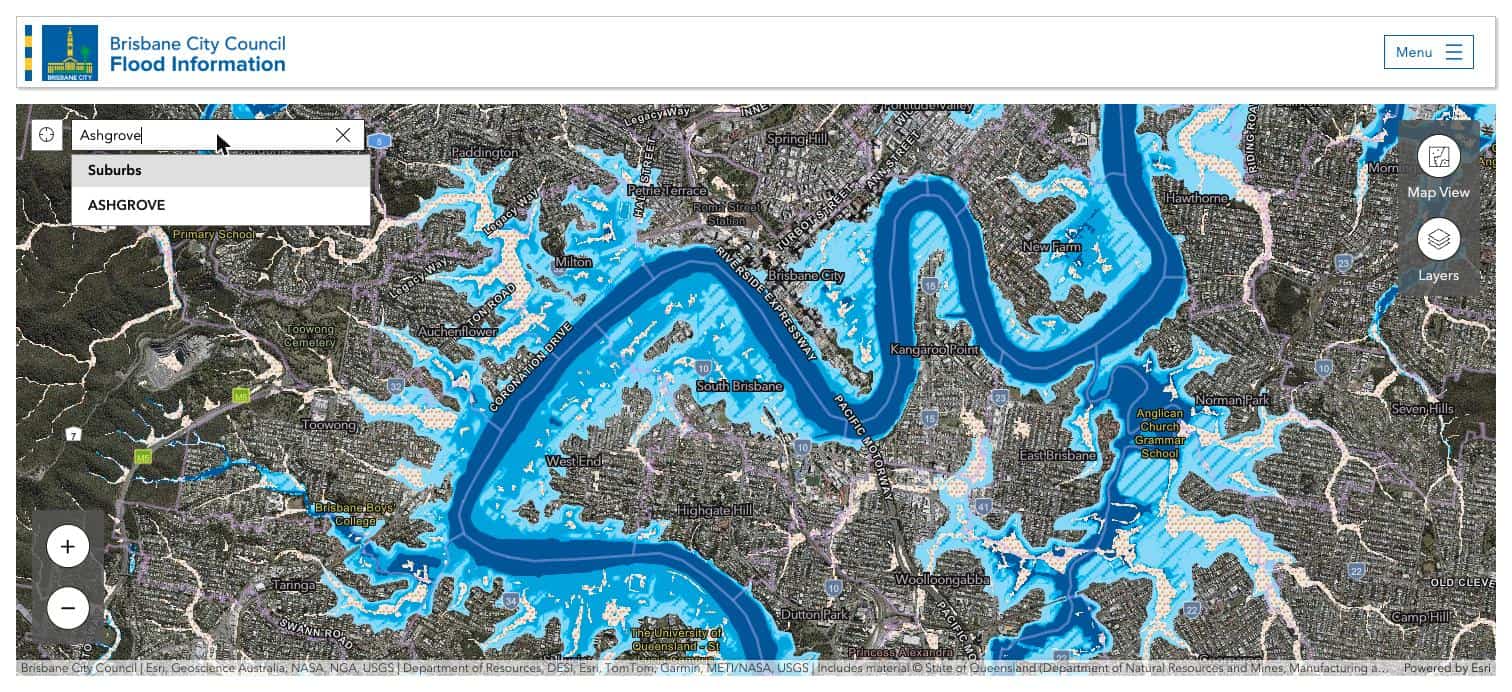
Start with council’s Flood Awareness Map. You’ll be asked to accept the conditions of use, then choose to search the map. Type the address, lot and plan or suburb into the search bar at the top left.
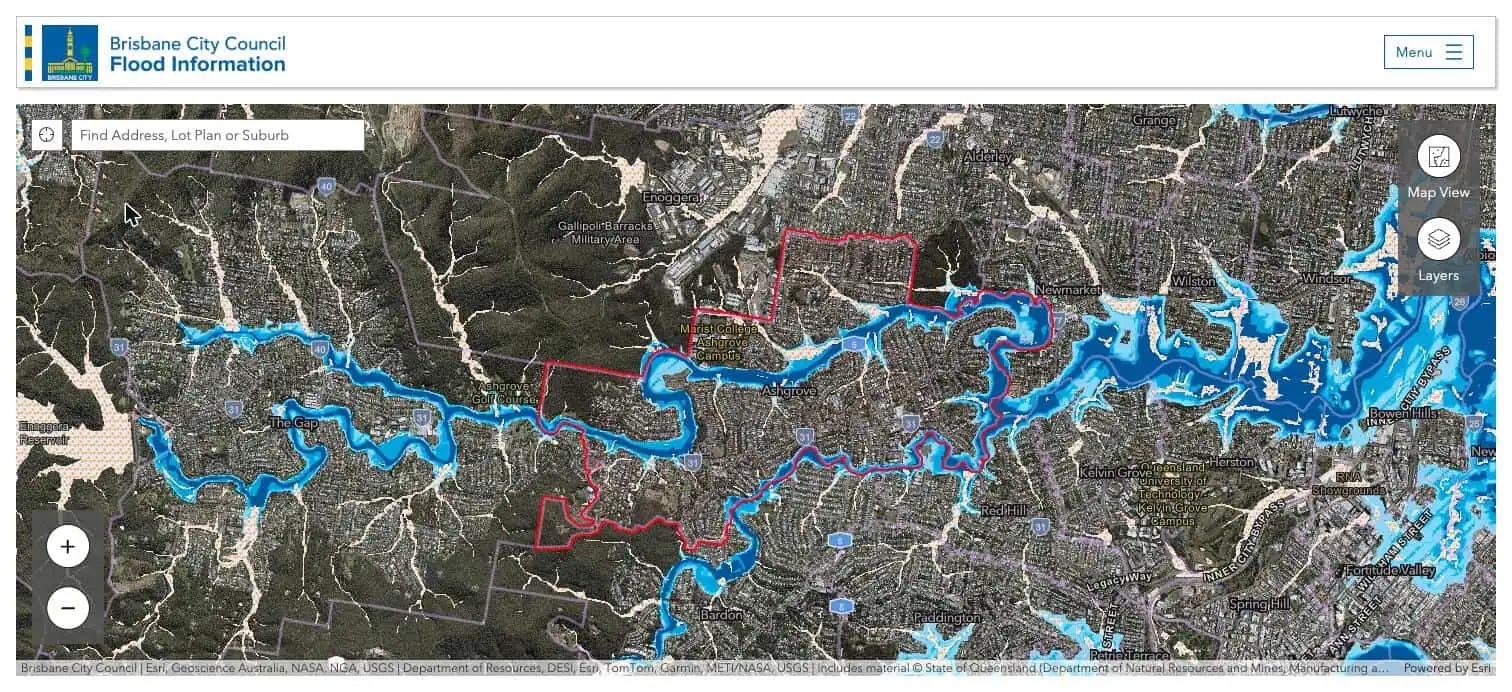
Searching a suburb first is a good way to get your bearings. Here is Ashgrove outlined in red, with Enoggera Creek winding through The Gap and Ashgrove before it forms the boundary with Red Hill and Bardon. The blue is creek flooding and the speckled orange is overland flow.
Step 2: Turn on the historic flood layers
Click Layers on the right. Current flood likelihood is shown by default, along with the February 2022 and January 2011 flood extents. I also tick January 1974, because some homes that stayed dry in 2011 went under in 1974.
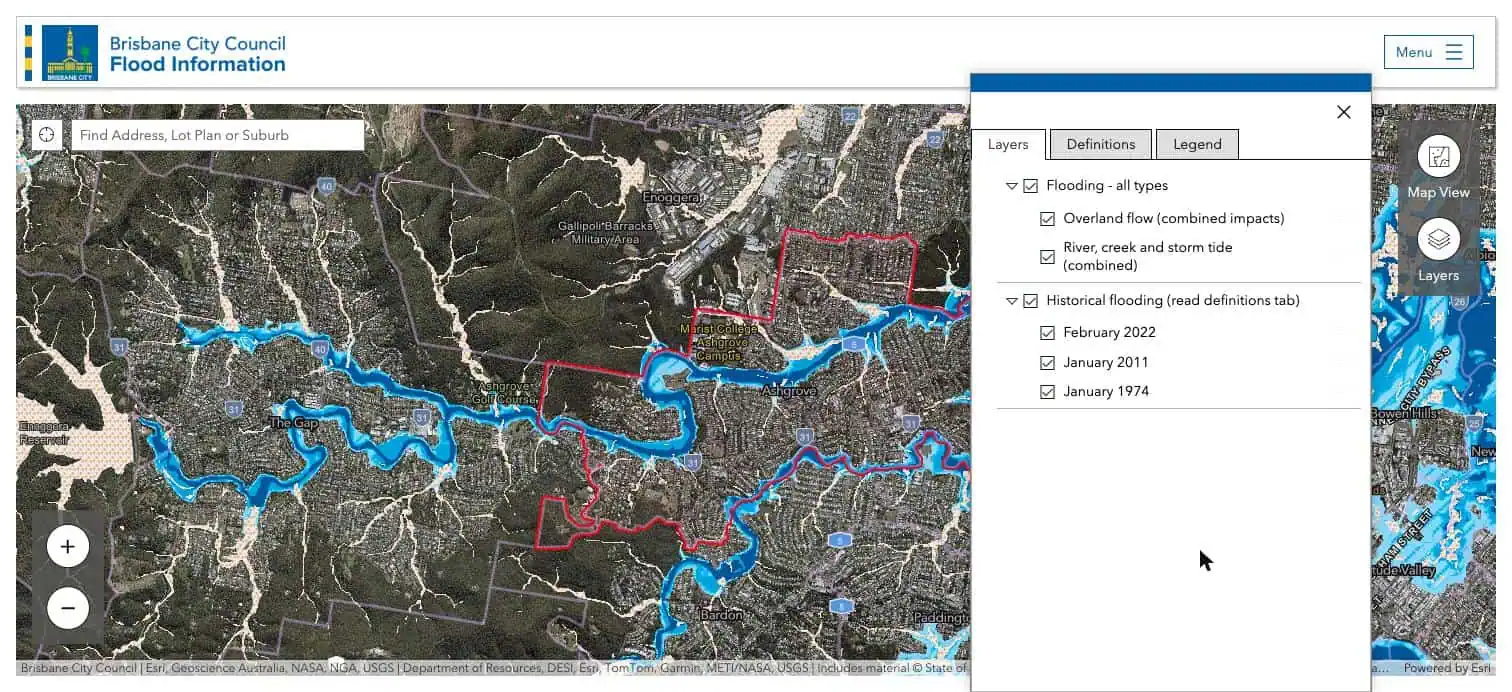
Historic extents are what actually happened. Modelled likelihood is what could happen. I want to see both, and if a home sits inside a historic extent I want to know whether the house itself went under or only the back of the yard.
Step 3: Read the legend properly
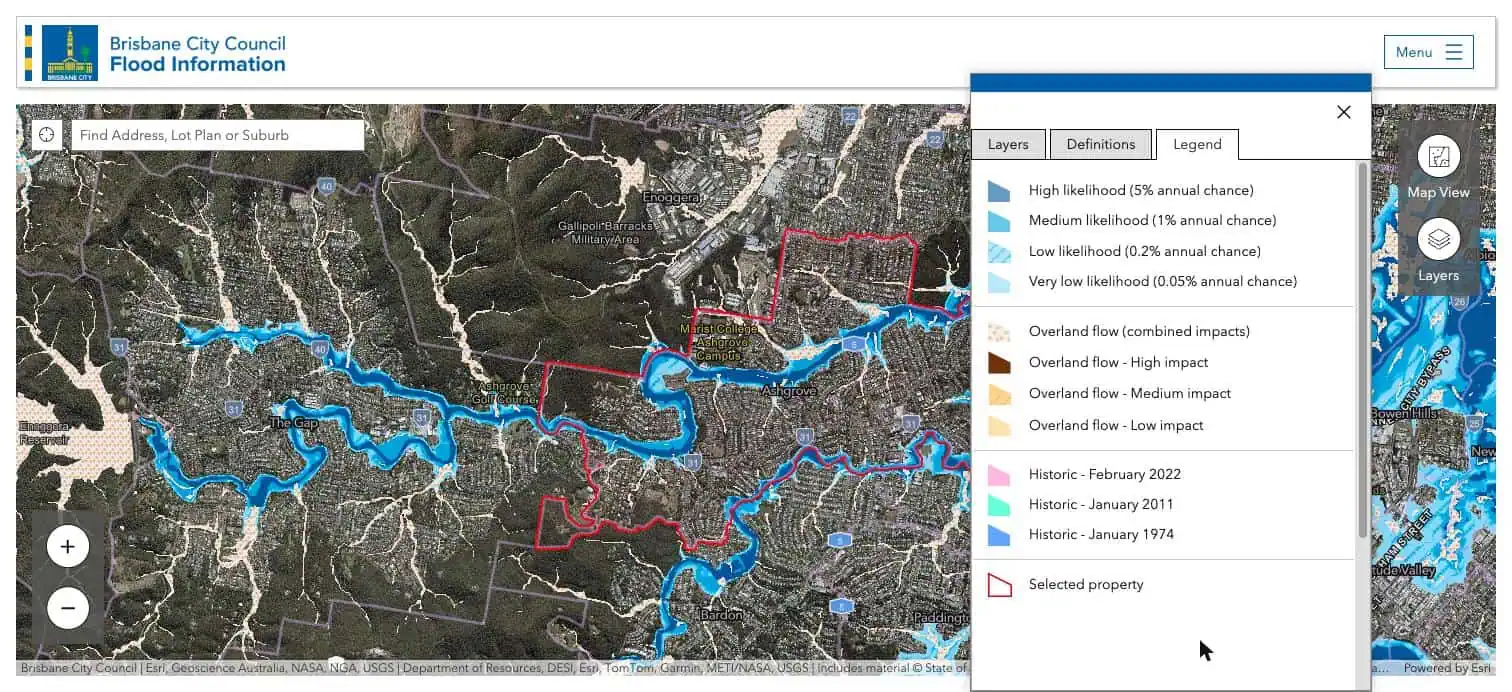
The Legend tab explains the colours. For river, creek and storm tide flooding there are four levels of likelihood:
- High: a 5% chance in any year (about 1 in 20)
- Medium: a 1% chance in any year (about 1 in 100)
- Low: a 0.2% chance in any year (about 1 in 500)
- Very low: a 0.05% chance in any year (about 1 in 2,000)
Overland flow is shown separately as high, medium or low impact. Overland flow is stormwater running across the ground after heavy rain, before it reaches a creek. It’s the type of flooding inner-west buyers most often miss, because it can happen well away from any creek.
A 1% chance a year sounds small, but over 30 years of owning a home it works out to roughly a one in four chance of seeing that flood at least once.
Step 4: Check the Flooding Overview for the property
Search the exact address. A Flooding Overview panel opens with a rating for river, creek, storm tide and overland flow flooding. As an example I can show publicly, here is Marist College at 142 Frasers Road, Ashgrove, which backs onto Enoggera Creek.
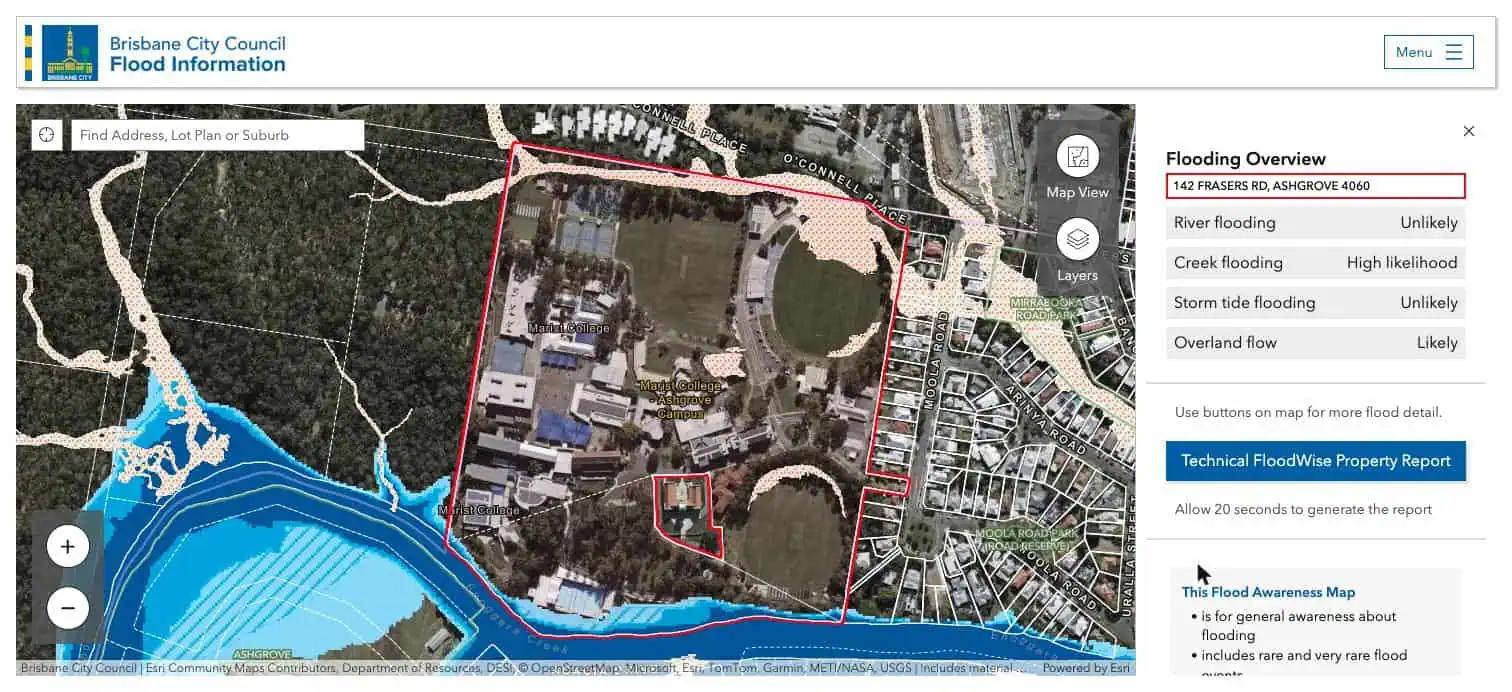
Creek flooding shows as high likelihood and overland flow as likely, yet most of the buildings sit well clear of the blue. That’s why the overview on its own isn’t enough. A home can be rated “likely” because the back fence touches a flood line. Zoom in and look at where the water sits in relation to the house, the driveway and the garage.
Step 5: Look at the neighbours
While you’re zoomed in, look at the homes on either side and across the street. Overland flow often runs down a driveway or along a side boundary and stops at the fence line. In the screenshot above you can see overland flow paths running through the homes to the north east of the college. If next door is in a flow path, the water has to go somewhere when the drains back up, and the street may be cut off even if the house stays dry.
Step 6: Open the FloodWise Property Report
Click Technical FloodWise Property Report in the panel. It takes about 20 seconds to generate and opens as a PDF. This is the report I read most closely.
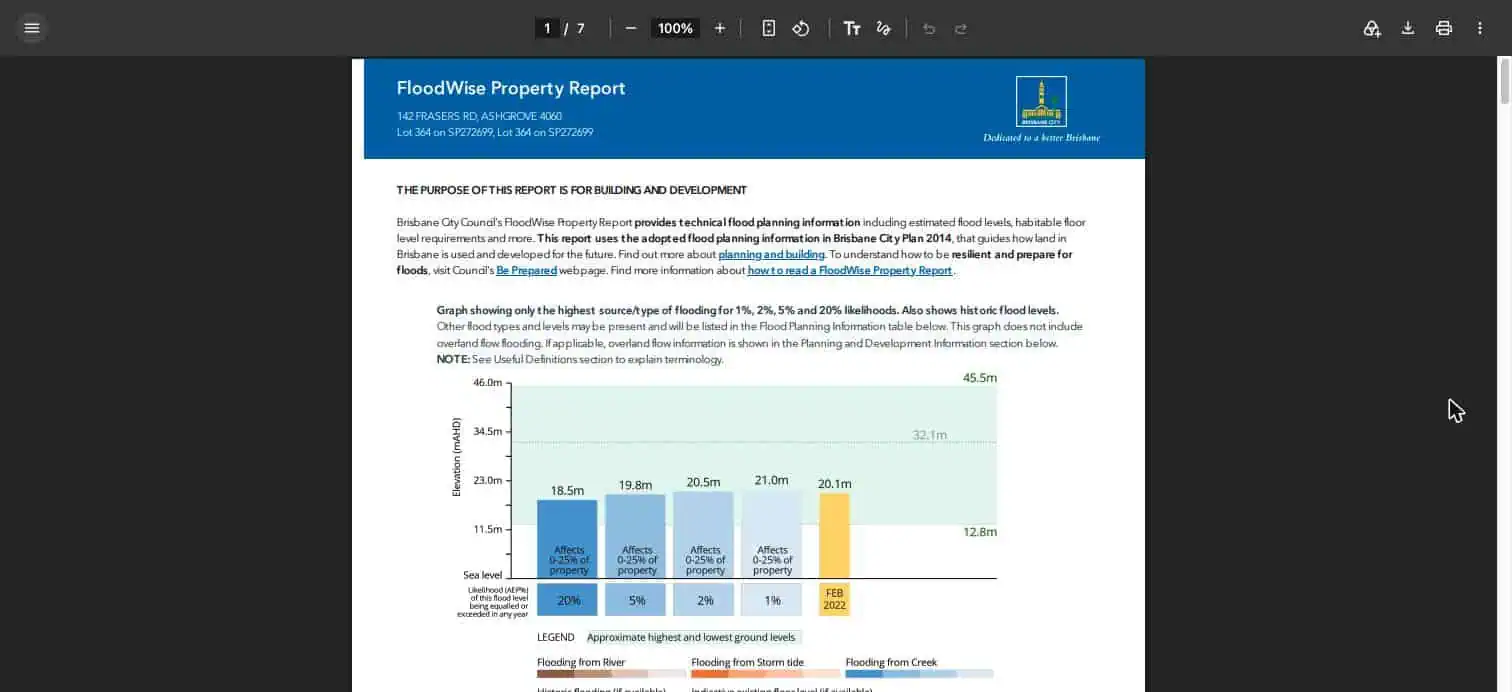
The graph compares the ground levels on the block with the modelled flood levels. In this example the ground runs from 12.8 metres to 45.5 metres above sea level. The 1% creek flood level is 21.0 metres, which would cover up to a quarter of the site, and the February 2022 flood reached 20.1 metres. On a big sloping block that’s very different from a level house block where the floor sits below the flood line.
Two things to keep in mind. The FloodWise report uses the flood planning information adopted in Brisbane City Plan, which council says can take longer to update than the Flood Awareness Map, so check both. And if you plan to renovate or rebuild, the report also sets out the minimum habitable floor level, which can decide whether raising or building in underneath is possible at all.
Step 7: Get an insurance quote before you sign
Ask an insurer for a building quote with flood cover on that address before you sign a contract. Premiums on flood-mapped homes can be much higher than you expect, and on some addresses flood cover isn’t offered at all. Under the standard REIQ house contract the property is at your risk from 5pm on the first business day after the contract date, so cover needs to be in place almost straight away.
Step 8: Check again before contract
If your search runs over a few months, run the check again before you sign. The 2025 creek update is a good reminder that the mapping is updated as new flood studies are finished.
Common mistakes buyers make
- Reading only the Flooding Overview ratings and not zooming in to see where the water actually sits.
- Ignoring overland flow because the home is nowhere near a creek.
- Relying on the agent’s comment that “it didn’t go under in 2011” without checking 1974 and 2022.
- Assuming the seller disclosure statement covers flooding. It doesn’t.
- Leaving the insurance quote until after the contract is signed.
My take
For most of my clients I steer away from homes where the house itself sits in a mapped flood area. The exceptions are usually riverfront or creek-front homes where the water is part of the appeal and the buyer understands the risk and has priced it in. A flood line across the bottom of a big block in Ashgrove or The Gap is a very different thing from water through the living areas, and the price should reflect which one it is.
Knowing how to check if a property is flood affected in Brisbane is one of the checks I run on every property before I put a value on it, along with the planning overlays, approvals and comparable sales. If you’d like to see the other checks I run in the suburbs I work in, my pages on Ashgrove, The Gap, Red Hill, Bardon, Paddington and Auchenflower are a good place to start, and my latest read on where Brisbane house prices sit now covers the wider market.
Flood checks: quick answers
How do I check if a house has flooded before in Brisbane?
Turn on the February 2022, January 2011 and January 1974 historic flood layers in Brisbane City Council’s Flood Awareness Map, then search the address.
Does the seller have to tell me if a property floods in Queensland?
No. The seller disclosure statement that started on 1 August 2025 doesn’t require flood history, so buyers need to check the council maps themselves.
What does a 1% annual chance of flooding mean?
There’s a 1 in 100 chance of that flood level being reached or exceeded in any given year. Over 30 years that adds up to roughly a one in four chance of it happening at least once.
Is the Flood Awareness Map the same as the City Plan flood overlay?
Not always. The Flood Awareness Map is updated as new flood studies are finished, while changes to the City Plan flood overlay go through a formal process and can take longer. The FloodWise Property Report uses the City Plan information.
If you’re thinking about buying in Brisbane’s inner west or simply want to talk through a property you’ve found, I’m always happy to share my view.
Take care, Sam Price. Buyer’s Agent and Registered Property Valuer, Brisbane.
The Templeton newsletter
Brisbane property through a valuer's eyes
Once a month I share the latest Brisbane figures, what I'm seeing at inspections across Brisbane and my newest suburb updates.